Discrete Optical Stretcher
The simple evolution of the tweezers
Explore the potentiality of the hand-made optical stretcher
Explore the potentiality of the hand-made optical stretcher
This optomicrofluidic device has a great importance in biological field, since it's able to explore cell mechanical properties like the elasticity of the cell membranes. From this parameter, it is possible to distinguish healthy cells from unhealthy.
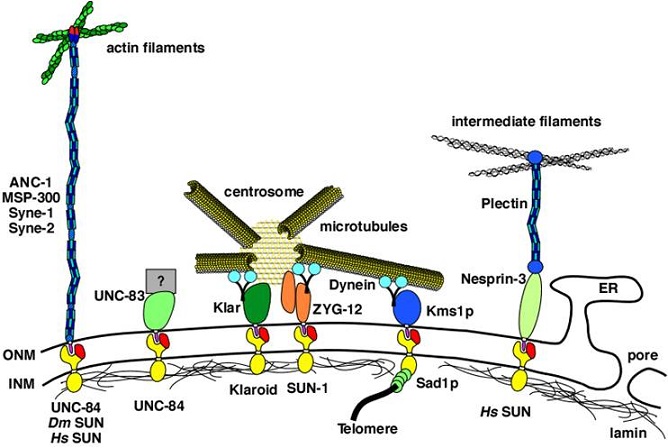
Cell mechanical properties are largely determined by the cytoskeleton, a polymeric network of various filaments, which plays an important role in many cellular processes. There are three different types of filaments forming the cytoskeleton: actin, microtubules and intermediate filaments.These cytoskeleton is the basic framework for various cellular activities and is always changing and adapting to its environment. The dynamic nature of this system is critical for processes such as differentiation, mitosis, motility, intracellular transport, phagocytosis, and mechanotransduction. This link between the processes mediated by a well-regulated cytoskeleton and cellular mechanical properties can be exploited to study these processes. Whenever a cell alters its cytoskeleton, its mechanical properties change, and this can be monitored by appropriate techniques. Changes can be brought about by physiological processes, by pathological perturbations, or in response to manipulations of a researcher.
A wide variety of experimental biophysical probes have been used to extract the mechanical properties of cells: (a) atomic force microscopy (AFM), (b) magnetic twisting cytometry (MTC), (c) instrumented depth-sensing indentation method. In these three techniques, a portion of the cell surface could be mechanically probed at forces on the order of 10-12÷10-6 N and displacements smaller than 1 nm.
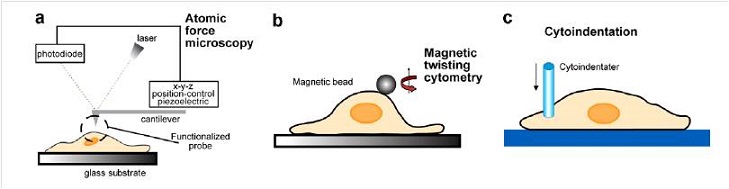
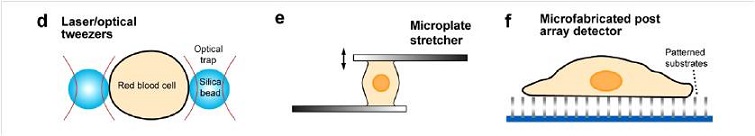
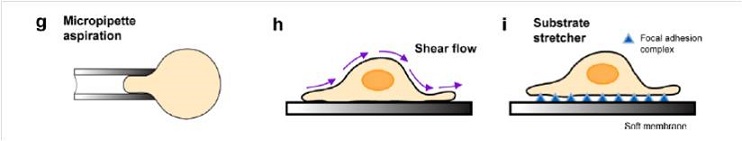
Other experiments involve: (d) laser/optical tweezers (OT), (e) mechanical microplate stretcher (MS), (f) micro-postarray deformation (mPAD) with patterned microarrays that serve as cell substrates. In these cases, forces over the range of 10-12÷ 10-7 N can be induced on the whole cell while submicrometer displacements are optically monitored.
Last three techniques are: (g) micropipette aspiration (MA), (h) shear flow technique and (i) substrate stretcher.
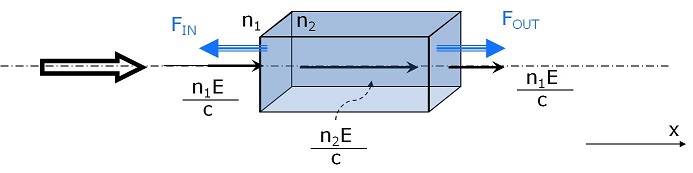
Our technique, involving a dual-beam optical trap configuration, is particularly interesting in the biological field because it allows either trapping in a stable and simple way micro-particles under test, or measuring cells mechanical properties with high precision, thanks to the possibility of applying high forces in a controlled manner. To understand the origin of the forces that deform the trapped cells we can rely on the dual beam theory. In the ray optics approach (2πr/λ<<1) we suppose that each portion of the particle surface appears as flat to the incident beams, so that we can approximate the cell with a square box with a refractive index n2 higher than that of the surrounding medium n1. If we consider a single Gaussian beam incident on the surface, it will carry a momentum p = n1 E/c, where E is the energy of the beam (Minkowski form).The beam momentum is proportional to the refractive index, it will then increase while entering in the cell. We have to consider that some light is always reflected at the interface. Anyway since cells are almost transparent, the reflection is almost negligible and can be disregarded. The momentum variation gives rise to a force that tends to accelerate photons and, for Newton third law, this force is balanced by a mechanical force proportional to Δp acting on the surface of the cell in the opposite direction. At the second interface, as sketched below, the photon exiting the particle will experience a decrease in the momentum hence the force arising on the surface cell will be directed along the propagation direction of the beam. In conclusion, when the beam passes through the particle surfaces, two forces are originated acting on the two interfaces in the direction opposite to the momentum increment, thus pulling the two surfaces outwards.
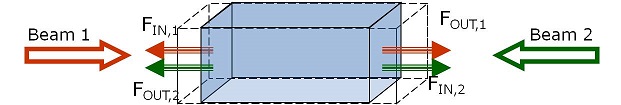
The second beam, entering the particle from the right, will generate the same force contributes on the surfaces. Hence, by increasing power, the particle stretches.
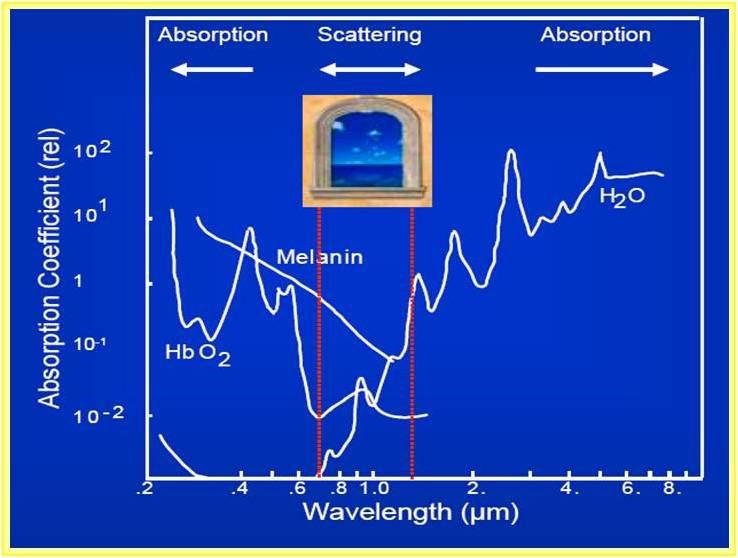
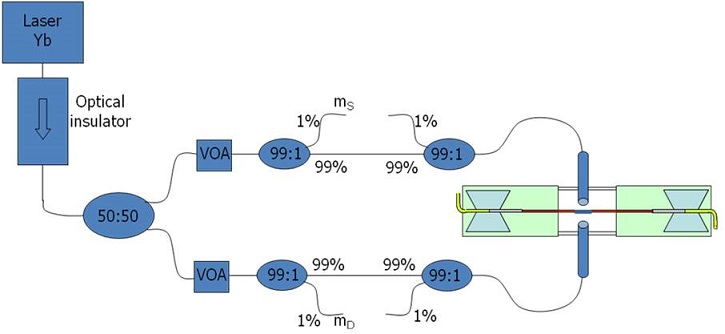
An Ytterbium–doped fiber laser at a wavelength λ=1070 nm is used as optical source for the dual beam optical stretcher. This choice is dictated by the absorption spectrum of biological sample. Indeed, as we can see in the figure below, the window between 700 and 1100 nm presents low absorption coefficient. For higher wavelength there is a higher absorption of water, while for lower wavelength we have high absorption of melanin and hemoglobin.
The use of a near infrared laser beam helps avoiding the heating of the trapped cell, thus lowering the death probability. The beam from the laser propagates through an optical insulator, which has been introduced to block the back reflections, and is then split into two paths by an optical coupler 50%/50%. It must be noticed that the power isn’t divided exactly in two equal parts, so we provided each path with a variable optical attenuator. In this way we can introduce bending power losses in order to have the same final power at the fibers tips. After the VOAs we put a couple of couplers 99%/1%; the 1% port of the first one provides a monitor that gives information about the optical power travelling in that branch, while the 1% port of the second monitor serves to check for the coupling between the two fibers, providing information about their alignment. Finally, the tips of the fibers are put on two sleighs and translated with a couple of 3-axys micromanipulators.
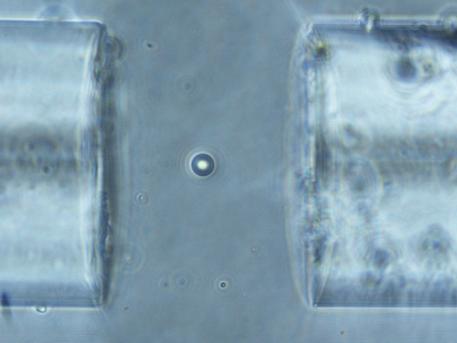
The second part of the setup is the fluidic part that is used to deliver the cell suspension in the region where the two fibers are facing. The microfluidic system is observed with an inverted phase contrast microscope, which is very useful in biological applications because it enhances the small difference between the refractive index of water and cells. The images are captured by means of a CCD camera Stingray for black and white pictures or Nikon for color images. We can achieve optical trapping with three fluidic configuration.
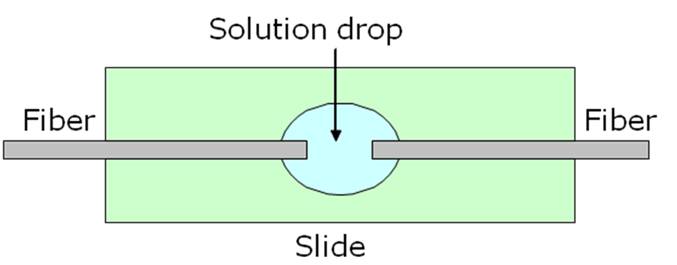
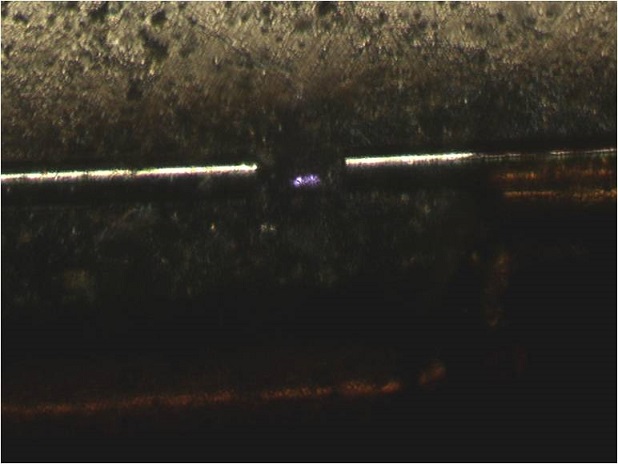
The first configuration of the fluidic part of the optical stretcher we implemented is very simple. It consisted in two counter propagating optical fibers having the tip inserted in a drop of solution containing the particles we wanted to analyze. Each fiber was stably put in a V-groove on an aluminum sleigh translated by a 3-axis micromanipulator.
With this setup we have been able to trap many kinds of microparticles, either biological (stem cells, red blood cells, yeast) or non-biological (polystyrene beads, liquid crystals). Anyway it has not been possible to obtain a fine stretching. The reasons are many. First there’s the very interaction between fibers and the solution. A lot of particles tend to attach to the tip of the fibers, with a consequent loss of power. Moreover the translation of a fiber inside the drop causes a movement of the liquid, making it very challenging to trap a particle. The 3-axys micromanipulator offers three controlled degrees of freedom, but little can be done to solve rotation misalignment of the fibers. Water turbulence also makes the system unstable, creating small oscillations of the fibers tip and making difficult to follow the particles. Finally, since the flow cannot be controlled, more than one particle gets trapped between the two fibers, preventing us from having stretching. This setup was nevertheless very useful in force measurement.
In order to get rid of some of the problems showed by the first configuration, we realized a second implementation,providing a guiding capillary for the optical fibers, to make an automatic alignment.
On a microscope slide we glued a big glass capillary, forming a smooth water-tight seal. Then we pushed two pieces of smaller capillaries along the previous one, providing a little gap for the solution drop. Finally we aligned the fibers by pressing them against the couple of smaller capillaries, which formed a backstop for the fibers and provided a V groove in which they sat. This way we achieved a good alignment and we reduced the water motility thanks to the barrage of the capillary. Unfortunately also this configuration showed some problems. First of all, the capillaries weren’t always well aligned and, because of the bending of the fibers, we couldn’t modify the alignment with micromanipulators. We lacked the translations of the fibers, so we couldn’t follow the particles, but we could only wait for the particles to approach the trapping area and try to remove other approaching particles. Like with the previously described configuration, we had problems with the dirt attached to the fiber-ends, which was now enhanced by the contact between fibers and microscope slide. In fact the particles suspended in the solution gradually settled on the glass, thus creating a layer of dirt that prevented from having a good trapping and a clear imaging.
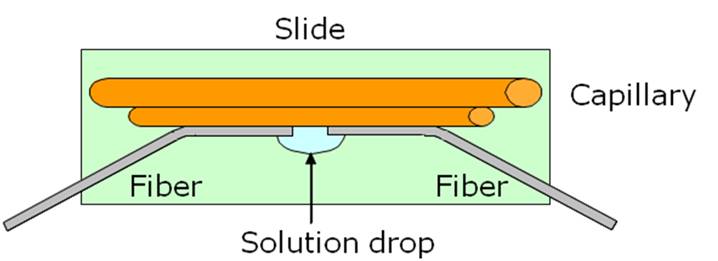
The last implementation got rid of all the problems of the setups described above. In order to obtain a microfluidic circuit to deliver the cells between the two fibers, but without inserting the fibers in the solution we followed a new approach. We took a glass square capillary with an internal and external dimension of 80 μm and 160 μm respectively and we glued the two ends of it to a couple of round capillaries with internal and external diameters of 200 and 350 μm respectively. Each capillary is then inserted and glued to two butterfly needles, which are in turn glued to a couple of microscope slides. The two slides are kept together by a couple of bigger glass rectangular capillaries, in order to have the square one suspended.
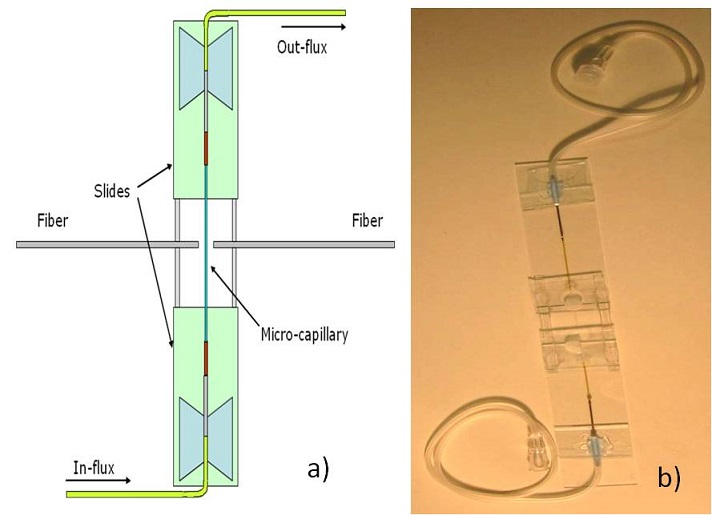
The solution is then inserted in the butterfly needle with a syringe and it is pushed along the microfluidic system until it reaches the other end. There are many advantages respect to the previous implementation.
The optical and fluidic parts are separated, thus preventing the problem of powder deposition on the fiber tip.
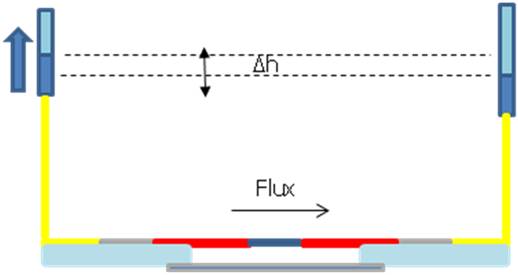
The flow is totally controllable, as sketched in Figure 3.18, so that we can get rid of inertial motion and we can trap only one particle at a time.
The microchannel can be cleaned, thus it is reusable.
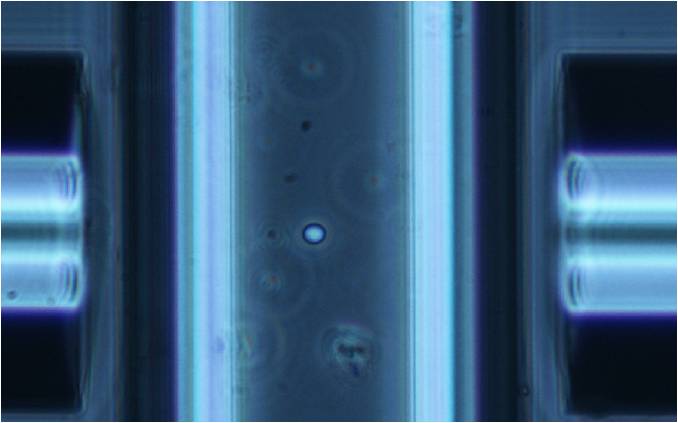
The fibers facing the square capillary are aligned with a couple of 3-axys micromanipulators and the rotational misalignment can be corrected pushing the fibers until the tip touches the capillary surface.
The flat interfaces between fibers, air, glass and water reduce power losses and beam deflections. Thanks to the flow control we can trap, stretch and release one cell at a time.
The goal of our measurements is the evaluation of the cell membrane elasticity. In order to do this the cell suspension under test streams in the microfluidic channel. Once trapped, the cells are progressively stretched by increasing the optical power. The analysis of the sample elasticity can be performed by comparing the images of the sample before, during and after the stretching. The images, captured through a high resolution CCD camera are analyzed through a Matlab software that automatically retrieves the edges of the cell, thus giving information on its elongation.
As already mentioned, In order to get information about the elongation of the cells we need a software able to analyze the pictures taken with the CCD and to retrieve the edges of the trapped particles. For this purpose we wrote some Matlab programs, each one with a specific task.
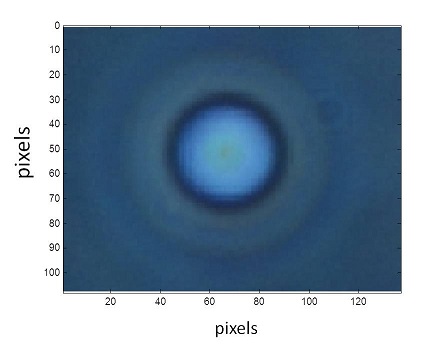
This program loads the CCD images and asks the user to define a cropping area, in order to shrink the size of the picture (Figure 3.20). This helps the following analysis, reducing the elaboration time and deleting external elements that interfere with the elasticity measurement.
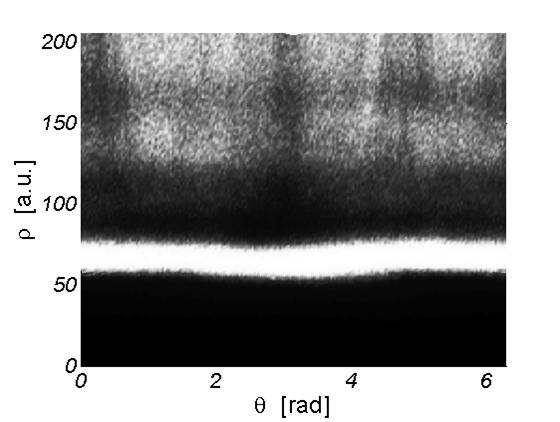
Once the images are cropped around the cell, this program converts them into grayscale and exalts the contrast. Then the user is asked to select a point at the center of the cell and the software converts the image in polar coordinates. At this point the image looks as in the following figure, where the white stripe represents the border of the cell.
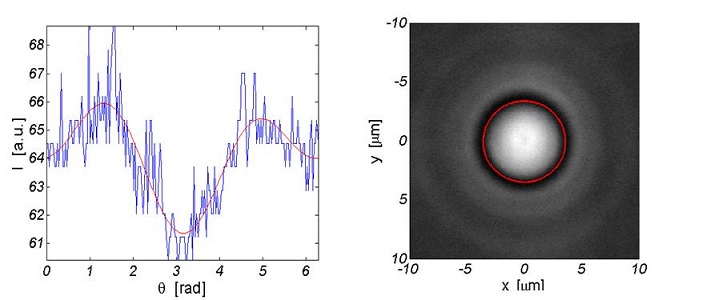
The user is then asked to define the band where the cell’s edge is, i.e. the user indicates a point over the white layer and a point below it. The image is then filtered with a threshold in order to enhance the intensity gaps. Then the program finds the middle point in the white stripe for each column of the figure, by a simple maximum analysis, and defines a rough profile. By Fourier transforming this result we are able to extract the dominant frequencies of the original data, thus obtaining a smooth profile.The information about the horizontal and vertical dimension of each cell are saved in a .txt file.
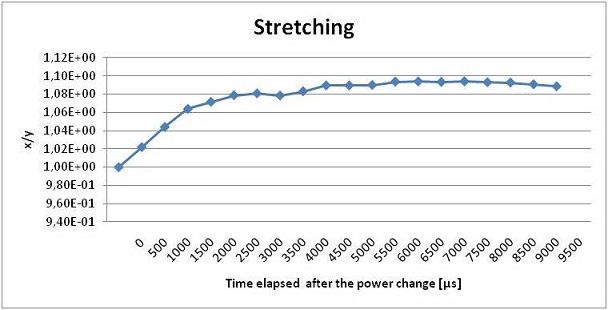
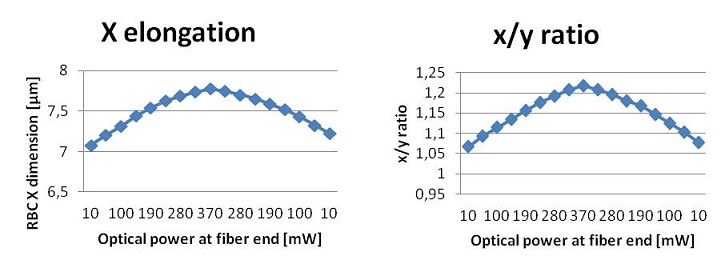
The last program loads each files txt and put all the information in an excel file. This way we get a sheet for the x and y dimension and for the ratio between the two dimensions of each cell as a function of the increasing power. Scheming the ratio x/y related to the increasing power P give the information of the cell stretching.
In order to evaluate the mechanical response of the cytoskeleton, we use two different approaches according as the laser stimulus in time is given to the cell as a step or a ramp function.
With a LabView program we set a laser power sufficient to trap the sample under test. Then we abruptly switch the laser power to a power high enough to deform the cell and with the same program we drive the CCD camera to acquire images of the trapped cells every 500 μs. We expect a deformation profile as the one shown in the figure below: a high slope for few seconds as the laser power increase and the cell starts to elongate, then almost flat profile since the saturation level of deformation is reached. This technique is useful to measure the response time of the cell to the applied stress.
With another LabView program we set the initial laser power at a level sufficient for trapping. Then we slowly increase the power at regular step, taking a snapshot of the cell at every step until we reach a defined maximum value, high enough to have a sensible deformation without damaging the cell. Then we decrease the power level in the same manner. This procedure is useful to measure the elasticity of the cell and to verify the viscoelastic behavior of the deformation.
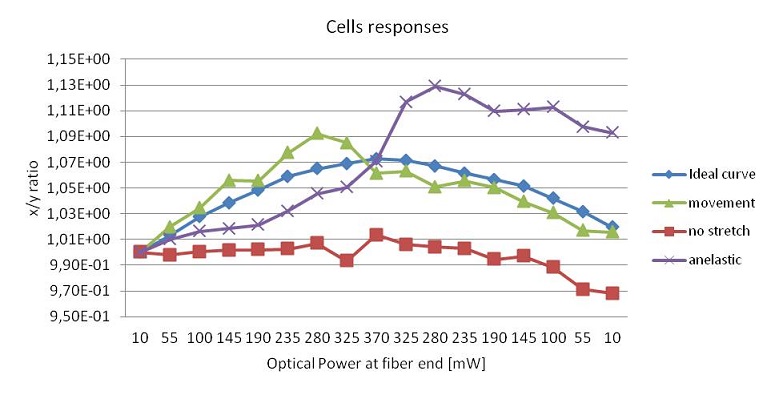
Unfortunately not all the measurements are good for the elasticity evaluation, so we have to get rid of the cells showing an unexpected behavior. It may happen indeed that some cells rotate when the stress is applied, or move vertically and change their focal plane as they become stretched. This slight change of focus can cause an apparent shift in the measured axial length and is often avoidable by slightly increasing the trapping power. While rotations can usually be eliminated by a good control of the flow, their effect on the strain curves is indistinguishable from an active behavior of the cells. The results can be further improved by removing the measurements of cells whose response does not conform to a true passive viscoelastic deformation. To this aim first we can remove the results of cells that don’t respond to the applied stress. Further selectivity can be achieved by removing the results of cells where the rate of deformation becomes negative while the stress is still being applied, and where the cell does not relax back after the stress has been reduced. These abnormal responses are likely caused by reorientation of the cell relative to the trap in addition to the deformation itself. Removing these results from the overall analysis leads to a reduced ensemble of viscoelastically deforming cells. These cells are the ideal candidates to be individually fit in order to obtain physical values useful to describe their mechanical properties. We applied the stretching technique to different cells; in this chapter the results of the analysis of red blood cells and tumor cells are reported.
Thanks to their lack of organelles and internal nuclei, red blood cells (RBCs) are the simplest cells type to analyze. They appear in the resting state with a biconcave shape, because it is the minimum energy state. Anyway RBCs constantly change their shapes as they’re subjected to a range of fluid forces in the circulation, as in the capillaries, where they fold along a longitudinal axis assuming an asymmetrical shape. This asymmetrical shape is maintained thanks to continuous movement of the membrane around the cytoplasm. Thus an RBC spends little of its time in discoid shape in the microcirculation. In addition, a wide variety of chemical perturbations induce shape changes, as the low concentration of fatty acids, modest changes of pH, decrement in ATP and more. In particular we’ve analyzed the cytoskeleton deformability in red blood cells affected by three different of diseases. All the measurements are based on a comparative analysis between healthy and diseased cells and the results create the basis for either increase the knowledge on the effect of the disease or to use these analyses as early diagnostic tests.
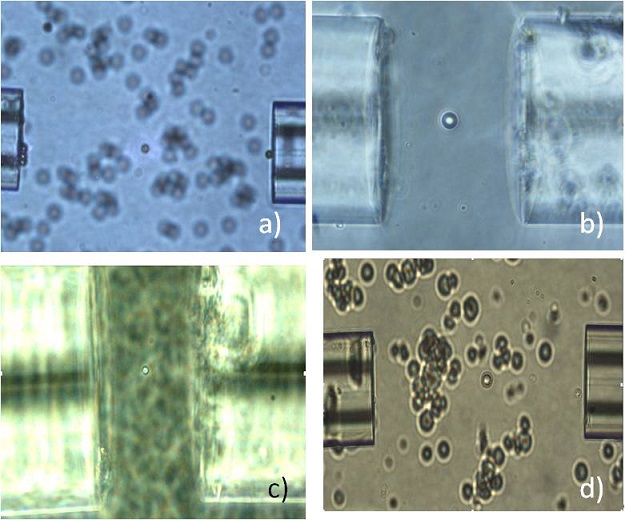
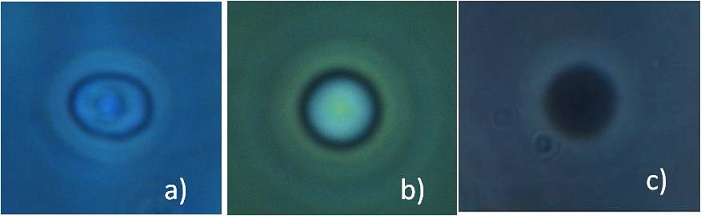
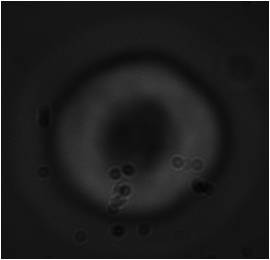
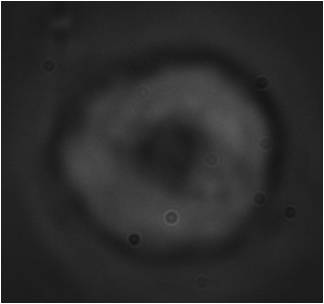
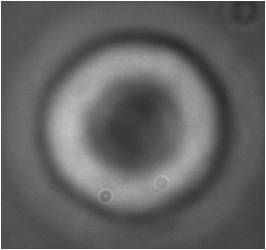
We tested the potential of the stretching technique in biological field collaborating first with the Dipartimento di Medicina interna, Istituto di cura Santa Margherita in Pavia, in order to analyze the elasticity of red blood cells of geriatric patient affected by diabetes mellitus type 2. This is a metabolic disorder that is characterized by high blood glucose in the context of insulin resistance and relative insulin deficiency. Among the hemorheologic changes in the blood samples, there is an increment of the aggregation and viscosity, which might be ascribed to a decrement in the membrane elasticity. These conditions prevent the erythrocytes from adapt its shape in order to reach the smaller capillaries, thus determining the occurrence of complications. The goal of this collaboration was to verify the hypothesis that the elasticity of diseased RBCs is reduced, causing the increment in viscosity, and to link the value of the cell elasticity to the status of diabetes, by applying the stretching technique to healthy and diabetic patients at different stages of the disease. The RBCs were diluted in a hypotonic solution in order to swollen their shapes and to obtain a spherical cell so as to simplify the elasticity analysis. Each blood sample was composed of 10 μl of blood, 4 ml of distilled water, 4 ml of physiological solution, then we added calcium albumin and glucose to provide nourish to the cells and heparin to prevent the cells from attaching to the capillaries walls. The final concentration was 50000 cells per ml of solution. The addition of distilled water brings to a swollen cell; anyway this stress can sometimes break the RBC membrane, so that part of the Hb exits from the cell giving rise to a ghost RBC. Ghost cells appear black with a phase contrast microscope because of the change in the refractive index, as shown in the last frame of the next figure. In our measurement we analyzed only the healthy ones.
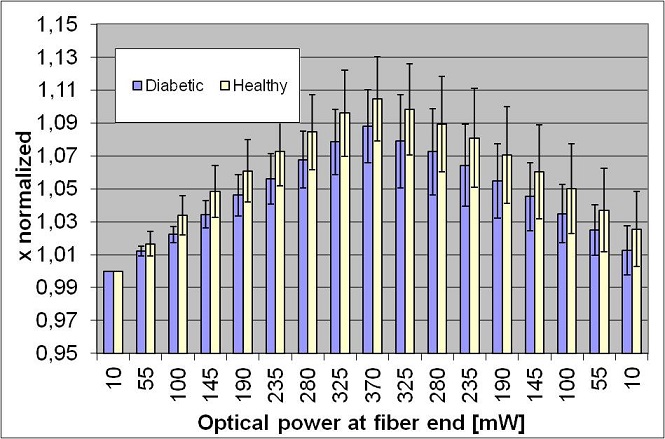
We analyzed the blood samples of 10 diabetic geriatric patients and 10 healthy geriatric patients. For each sample we trapped and stretched 50 red blood cells, in order to get a good statistic of the elongation. Each cell was stressed with a ramp approach with an optical power at fiber ends increasing from 10 to 370 mW, then decreasing back to 10 mW . The pictures were analyzed with a MatLab software in order to get information about the x and y dimensions and their ratio. These results were averaged over all the red blood cells measured for each patient. Then we averaged the results over all the patients in the same group and we compared the two groups. We reported the average elongation along the beam axis of the healthy cells compared to the diabetic cells; the black segments represent the standard deviation of the measurements. We can see that healthy cells deform the most, in fact the ascent and descent slopes are higher than those of the diabetic cells. This result confirms the initial hypothesis that the altered blood viscosity in diabetic patient is linked to a reduced elasticity of red blood cells membrane.
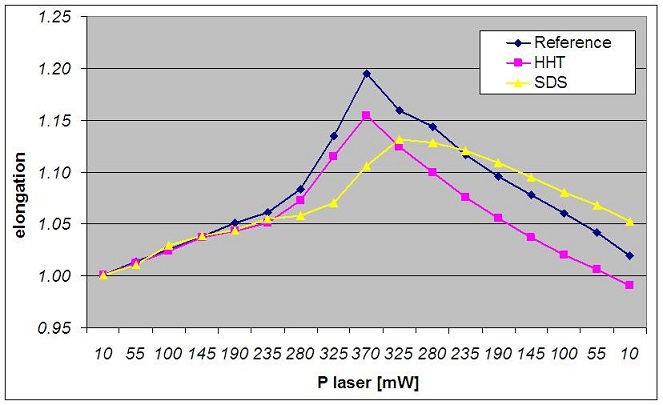
We collaborated with the Dipartimento di Patologie Umane Ereditarie at University of Pavia to analyze the behavior of red blood cells affected by two kind of rare hereditary diseases that can bring the patient to develop anemia: the Hereditary Hemorrhagic Telangiectasia (HHT) and the Shwachman-Diamond Syndrome (SDS). HHT is a genetic disorder that leads to abnormal blood vessel formation in the skin, mucous membranes, and often in organs such as the lungs, liver and brain. It may lead to nosebleeds, acute and chronic digestive tract bleeding, and various problems due to the involvement of other organs. These lesions may bleed intermittently, which is rarely significant enough to be noticed but eventually leads to depletion of iron in the body, resulting in iron-deficiency anemia. SDS is a rare congenital disorder characterized by exocrine pancreatic insufficiency, bone marrow dysfunction, skeletal abnormalities, and short stature. The most common hematological finding, neutropenia, may be intermittent or persistent and the low neutrophil counts leave patients at risk of developing severe recurrent infections that may be life-threatening. Anemia and thrombocytopenia may also occur. Bone marrow is typically hypocellular, with maturation arrest in the myeloid lineages that give rise to neutrophils, macrophages, platelets and red blood cells. Patients may also develop progressive marrow failure or transform to acute myelogenous leukemia. For these pathologies the basic genetic and clinical data are well known; however the details about pathogenetic mechanisms are far from being completely defined and understood and a large amount of clinical variations are observed, not only among different families, but even between sibs sharing the same mutations. The application of non invasive optical techniques to evaluate mechanical and chemical properties of RBCs and neutrophils at single cell level will provide important information on their correct or abnormal functioning shading new light on the link between the molecular basis of these pathologies (i.e. genes mutations) and the effects of the diseases on patients. We expect these studies to be relevant to aid early diagnoses and prognosis and will be straightforward for the acquisition of a complete knowledge of the two pathologies. We have analyzed HHT, SDS and healthy red blood cells, stretching 50 RBCs for each patient in a hypotonic solution. The figure below shows the elongation as a function of the laser power impinging on the cell during the measurements; each point in the graph is obtained as the average value over the measured RBCs. The three curves show different behaviors, indeed the reference sample (healthy RBC) appears to reach a higher elongation with respect to the HHT and SDS samples. Moreover we can observe that for the SDS sample, RBCs seems to elongate more on average when the laser power starts to decrease and they doesn’t return to the original dimension. These results should be considered as very preliminary, indeed only few samples have been measured up to now because of the rarity of SDS patients; anyway we believe that these results demonstrate the feasibility and the relevance of the proposed research, since they already let us envisage the possibility to study different behaviors for cells pertaining to different diseases. It is also noticeable that HHT cells stretch more than SDS cells. Indeed HHT causes a continuous production of red blood cells in response to the frequent bleeding, so we assume that these cells are “younger” and more elastic than those of SDS patients, in which the reduced generation of RBCs lead to an “older” cell population.
The effectiveness of the optical stretcher as a device for biological investigation and early disease diagnosis, through the evaluation of elasticity as a marker of the cell status, has been demonstrated by Guck and Kas in their study of tumor cells. During the cell’s progression from a fully mature, postmitotic state to a replicating, motile, and immortal cancerous cell, the cytoskeleton devolves from a rather ordered and rigid structure to a more irregular and compliant state. The changes include a reduction in the amount of constituent polymers and accessory proteins and a restructuring of the available network. These cytoskeleton alterations are evident because malignant cells are marked by replication and motility, both of which are inconsistent with a rigid cytoskeleton. Taken together, these changes in cytoskeleton content and structure are reflected in the overall mechanical properties of the cell as well. Thus, measuring a cell’s rigidity provides information about its state and may be viewed as a new biological marker. We are collaborating with two medical groups for the analysis of tumor cells: the Institute of Molecular Biology - CNR - of Pavia for the study of fibroblasts and the IIT of Genova for the analysis of lymphocytes.
We’ve conduct experiments on three mutations of lymphocytes, analyzing their deformation under a step-stretching approach. The cells lines were IM9, K562 and JURKAT. IM9 is a lymphocytes mutation caused by multiple myeloma, a cancer of plasma cells. They cause bone lesions and they interfere with the production of normal blood cells in the bone marrow. Most cases of myeloma also feature the production of a paraprotein, an abnormal antibody that can cause kidney problems and interferes with the production of normal antibodies leading to immunodeficiency.
K-562 is an erythroleukemia cell line derived from a chronic myeloid leukemia patient in blast crisis. Recent studies have shown that K562 blasts are multipotential, hematopoietic malignant cells that spontaneously differentiate into recognizable progenitors of the erythrocyte, granulocyte and monocytic series. K562 cells were the first human immortalized myelogenous leukemia line to be established. The cells are non-adherent and rounded, are positive for the bcr:abl fusion gene and bear some proteomic resemblance to both undifferentiated granulocytes and erythrocytes.
JURKAT cells are an immortalized line of T lymphocyte cells that are used to study acute T cell leukemia, T cell signaling, and the expression of various chemokine receptors susceptible to viral entry, particularly HIV. Their primary use is to determine the mechanism of differential susceptibility of cancers to drugs and radiation.
We’ve performed a step-stretching measurement for all of the three kind of cell starting from an initial fiber power of 5 mW and switching to 405 mW. The results are shown in the following figures; each dot represents the average value of elongation over the measured RBCs at a specific time value.
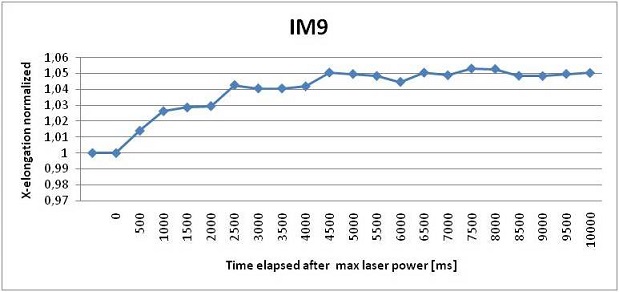
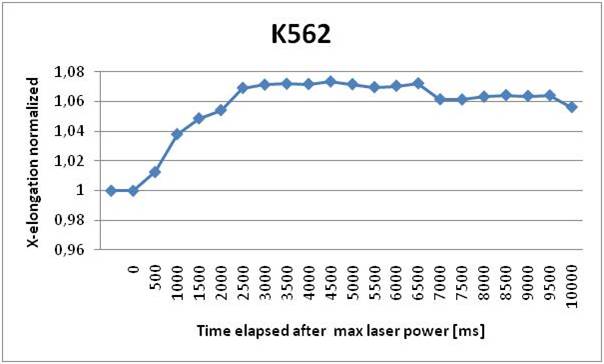
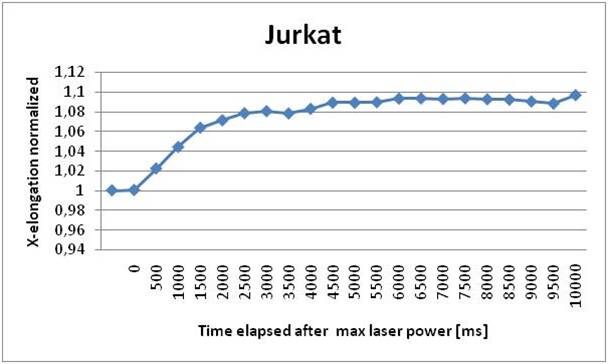
We can see that the elongation curve for IM9 cells arrives at a regime value after 3 seconds. From the analysis we verified the fragility of these cells, in fact many cells break the membrane during the stretching process. Their dimensions are also very variable, they can measure from 9 to 20 μm in diameter. The maximum stretching achieved is about 5% of the cell dimension. K562 cells proved to be more elastic than IM9 cells and their dimension is more homogeneous, going from 13 to 18 μm. They also take 3 seconds to reach full elongation of about 7% of its initial dimension. Finally we found that JURKAT cells deteriorate the least respect to the other mutations and they have the most homogenous shape. They reach the full elongation in 3 seconds and their dimension varies from 10 to 15 μm. They also stretch the most, reaching an elongation of about 11%. The comparison of the three results leads to a distinction in elasticity; a higher statistic will probably improve their difference.
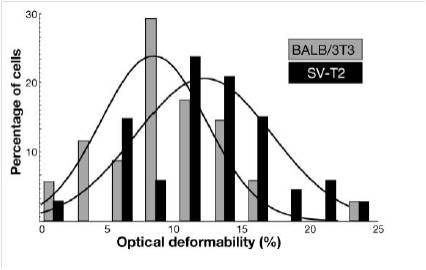
In human cells, an indefinite replicative potential is strictly related to the capability to maintain telomeres, the terminal parts of the chromosomes. Telomeres are DNA-protein structures essential for the maintenance of chromosome stability; in most normal somatic cells, telomerase activity is too low to elongate telomeres, which thus shorten at each cell division, limiting the life span of normal human somatic cells in culture. The link between telomere maintenance and unlimited proliferative potential was experimentally shown by introducing the gene coding for the human telomerase catalytic subunit (hTERT) under the control of a constitutive promoter into normal fibroblasts. Expression of the catalytic subunit leads to the reconstitution of telomerase activity and allows cells to abrogate cellular senescence and to divide indefinitely. These immortalized fibroblasts (Cen3) can actually acquire a transformed phenotype: if they are inoculated into nude mice at later culture passages, they become first tumorigenic (Cen3tel), then metastatic (Cen3tel 1000). We used the optical stretcher to analyze these cell lines with the aim of finding a difference in the cytoskeleton elasticity between Cen3 and Cen3tel 1000 and exploit this data to recognize the stage of evolution of the cancer. This work has been made in collaboration with the “Istituto di Genetica Molecolare, Consiglio Nazionale della Ricerche” in Pavia. A similar work was performed in Cavendish Laboratory by Guck’s group and led to the detection of mechanical differences between BALB/3T3 (healthy cells) and SV-T2 (tumorigenic cells) fibroblasts. Differences in the cytoskeleton composition of these cells could be observed with fluorescence confocal microscopy.
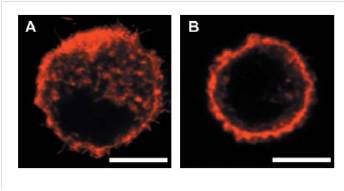
The difference in the actin distribution, thus the different elasticity of the two samples, was evaluated by a ramp stretching measurement. The tumorigenic cells, whose cytoskeleton structure devolves into an irregular state, deform the most.
On the basis of the results found in literature, we performed a step-stretching on Cen3 and Cen3tel-1000 cells with a maximum fiber power of 600 mW and we analyzed the elongation along the beam axis. In the following figures we report the Excel graphs showing the results obtained in the deformation of the two samples.
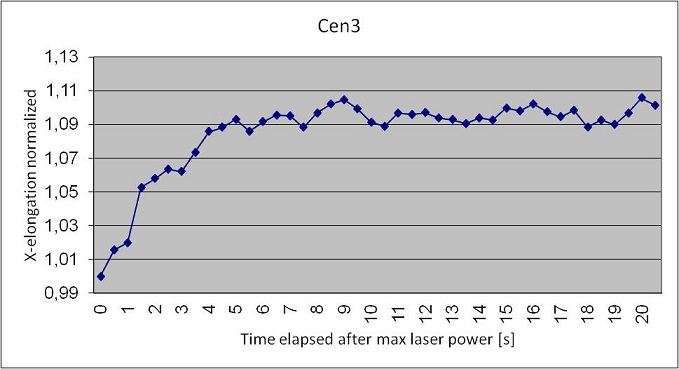
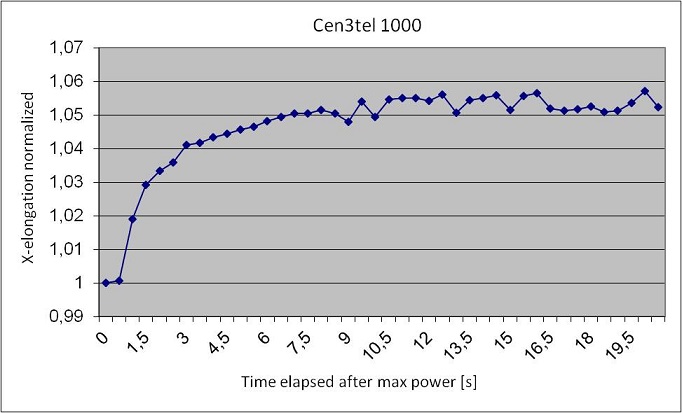
We have analyzed a reduced number of Cen3 cells respect to the Cen3tel 1000; in fact they tend to stuck together, thus blocking the solution flow inside the microchannel and becoming not analyzable. Anyway from the measurement we observed that he maximum elongation along the beam axis of a healthy fibroblast is higher than the elongation of a metastatic fibroblast; Cen3 cells reach the maximum deformation of 10% in 5 seconds, while Cen3tel 1000 reach a deformation of 7% in 9 seconds. This is in disagreement with the results obtained by Guck et al.; anyway we have a hypothesis to explain this unexpected behavior. We used the same setup for each kind of cell, but Cen3 cells are much bigger then metastatic cells; they vary from 20 to 40 μm, while Cen3tel 1000 vary from 15 to 20 μm. Optimal stretching conditions occur when the beam waist is slightly bigger than the trapped particle, and that’s the case of the metastatic cells, while the Cen3 cells are bigger than the waist, so they’re more subjected to axial stress than the Cen3tel 1000. We believe that a higher distance between the optical fibers will lead to correct results. Moreover is worth to underline that this work is just at the beginning and so far we have analyzed only a few samples; a higher statistic and the application of a Student’s T-test for the analysis will help in obtaining the correct results.